Blood Sugar Variability Explained: Why Your Glucose Swings and How to Steady Them
Two people can have exactly the same HbA1c of 7 percent and live very different glucose lives. One person may have a calm, flat line that stays between 90 and 160 mg/dL all day. The other may swing between 50 and 300 mg/dL, with dramatic highs after meals and frightening lows at night, and the average of those swings may still land at the same HbA1c. This hidden difference has a name: glucose variability. In this article we present blood sugar variability explained in clear, everyday language so that you can understand what it means for your health.
The topic is especially relevant in Pakistan. According to the IDF Diabetes Atlas 2025, about 34.5 million adults in the country were living with diabetes in 2024, and a large share have never had detailed glucose monitoring. Most patients are told their HbA1c and fasting number, yet these figures say little about the swings between them. Having blood sugar variability explained, and seeing it live with a continuous glucose monitor in Pakistan, changes how people understand their condition.
In the sections below you will find blood sugar variability explained step by step: what it is, how it is measured, what causes it, why it matters, what Pakistani food and lifestyle have to do with it, and what you can do to steady your glucose. This article is educational only and does not replace the advice of your doctor.
What Is Glucose Variability?
Glucose variability describes how much and how fast your blood sugar moves up and down over time. It can refer to swings within a single day, differences from one day to the next, or changes across weeks. When we say blood sugar variability explained, we are really asking how stable or unstable the glucose curve is, not just where its average sits.
Why the Average Is Not Enough
HbA1c reflects your average glucose over roughly the past two to three months. It is an extremely valuable test, but because it is an average, highs and lows can cancel each other out. A person with many lows and many highs may end up with an average that looks acceptable, and nobody notices the dangerous swings in between. This is the core idea behind blood sugar variability explained in modern diabetes care: the shape of the curve matters, not only the average.
Normal Variability Exists
Even people without diabetes have small changes in glucose. They rise after meals and fall slowly between them, but their bodies correct quickly, so the line stays within a narrow band. Having some variability is normal. The goal for people with diabetes is not a perfectly flat line, which is unrealistic, but a pattern that stays mostly within a safe target range with few extreme excursions.
How Variability Is Measured
Doctors and researchers use several measures. You do not need to memorize them, but knowing the main ones helps you read your own reports.
Standard Deviation
Standard deviation tells you how far readings typically sit from your average. A larger number means more spread. It is easy to compute but depends on the mean, so a person with a high average will naturally have a higher standard deviation.
Coefficient of Variation
The coefficient of variation, often written as CV, expresses the standard deviation as a percentage of the mean. This makes it a fairer measure of stability. International expert consensus on continuous glucose monitoring has suggested that a CV of 36 percent or lower indicates relatively stable glucose, while higher values suggest greater instability and a higher risk of hypoglycemia. If you see a CV on your sensor report, this is the number to look at when you want blood sugar variability explained in a single figure.
Time in Range
Time in range is the percentage of time spent between 70 and 180 mg/dL, which is the common target for most adults with diabetes. Consensus guidance suggests that many adults with type 1 or type 2 diabetes should aim for more than 70 percent of time in range, less than 4 percent of time below 70 mg/dL, less than 1 percent below 54 mg/dL, less than 25 percent above 180 mg/dL, and less than 5 percent above 250 mg/dL. Targets are personalized, and older adults or people at high risk of lows may have different goals, so discuss yours with your doctor.
Glucose Management Indicator
The glucose management indicator, or GMI, is an estimate of HbA1c based on sensor data. It can differ from lab HbA1c in some people, but it provides a helpful snapshot between lab visits.
Other Measures
Researchers also use measures such as the mean amplitude of glucose excursions, which captures the size of peaks and valleys, and the interquartile range of the ambulatory glucose profile. These are mostly used in studies, but the overall idea is the same: more swing means more variability.
Why Variability Matters
Understanding blood sugar variability explained is not only an academic exercise. It has practical consequences.
Hypoglycemia Risk
Large swings are closely linked to low blood sugar events. When glucose is highly variable, there is a greater chance it will dip below 70 mg/dL, especially in people using insulin or sulfonylureas. Repeated lows can be dangerous, particularly at night, and they can lead to hypoglycemia unawareness, where the body stops giving warning signs.
Symptoms and Quality of Life
Fast swings can leave you tired, irritable, hungry, foggy and unwell even when your average looks fine. Many people feel better when their curve is smoother, because their energy, mood and concentration become more predictable.
Long-Term Complications
Sustained high glucose is the main driver of complications in the eyes, kidneys, nerves and heart. Whether variability adds its own risk beyond the average is still being studied, and the evidence is mixed. Some studies suggest that large swings may increase oxidative stress and inflammation in blood vessels, while others find that most of the harm is explained by average glucose and time spent high. A fair summary is that stability is likely beneficial, but the strongest evidence still supports lowering overall glucose and avoiding severe lows.
What Causes Glucose Swings
Once you have blood sugar variability explained in terms of measurement, the next question is why it happens. Almost everything in daily life can nudge your curve.
Food Composition and Portion Size
Large portions of refined carbohydrates, sugary drinks and sweets cause sharp rises. Meals that combine carbohydrates with fiber, protein and healthy fat usually lead to flatter curves. The same food can behave differently depending on the time of day, the order in which you eat it and what else is on the plate.
Medicine Timing and Dosing
Insulin, sulfonylureas and some other medicines can cause lows if they are mismatched to food or activity, and highs if doses are missed or too small. Variability often falls when medicine timing and doses are tuned using continuous data.
Physical Activity
Exercise generally lowers glucose and improves insulin sensitivity, but intense activity can cause temporary rises, and prolonged activity can cause delayed lows. Inconsistent activity patterns, such as a very active weekend and a sedentary week, lead to bigger swings.
Sleep and Stress
Poor sleep raises insulin resistance and appetite, and stress hormones such as cortisol push glucose upward. Irregular schedules, shift work and emotional strain all add to the swings.
Illness and Dehydration
Infections, fever, diarrhea and dehydration disturb glucose control and make the curve less predictable. Steroids and some other medicines also raise glucose in specific patterns.
Hormones and Life Stages
Monthly hormonal changes in women, pregnancy, puberty and menopause all affect insulin sensitivity. Many women see variability rise in the days before their period, and a sensor makes this pattern visible.
The Dawn Phenomenon and Night Lows
Early morning hormone surges can lift glucose before waking, and night-time lows can occur after evening medicines or exercise. Both add to daily variability and are easiest to spot on a continuous graph.
Pakistani Food, Routine and Variability
Our lifestyle creates a particular pattern of swings. Breakfasts of paratha, puri, halwa and sweet chai deliver a heavy carbohydrate load when morning insulin resistance is high. Lunch and dinner often feature rice, roti and rich gravies, with a gap of many hours between them. Dinner is often late, followed by sweets or tea. Snack time includes samosas, biscuits and sweet drinks, and social events add large servings of biryani and dessert.
Big Gaps and Big Meals
Long gaps between meals followed by large servings produce a sharp climb after each meal and a slow descent before the next, a pattern that raises variability. Distributing food more evenly, with smaller balanced meals and protein-rich snacks, can help flatten the curve, always in line with your doctor’s advice and your medicines.
Sugary Drinks and Chai
Sugar in tea, bottled juices and soft drinks creates quick spikes that many people do not link to their numbers. A sensor shows this effect clearly and often convinces people to reduce sugar more effectively than advice alone.
Ramadan Patterns
During Ramadan, long fasting periods followed by a heavy iftar create a distinctive pattern of low glucose at the end of the fast and a high peak after iftar. Variability can increase unless iftar and sehri are planned carefully, and continuous data makes it easier for your doctor to adjust treatment.
Reading Your Sensor Report
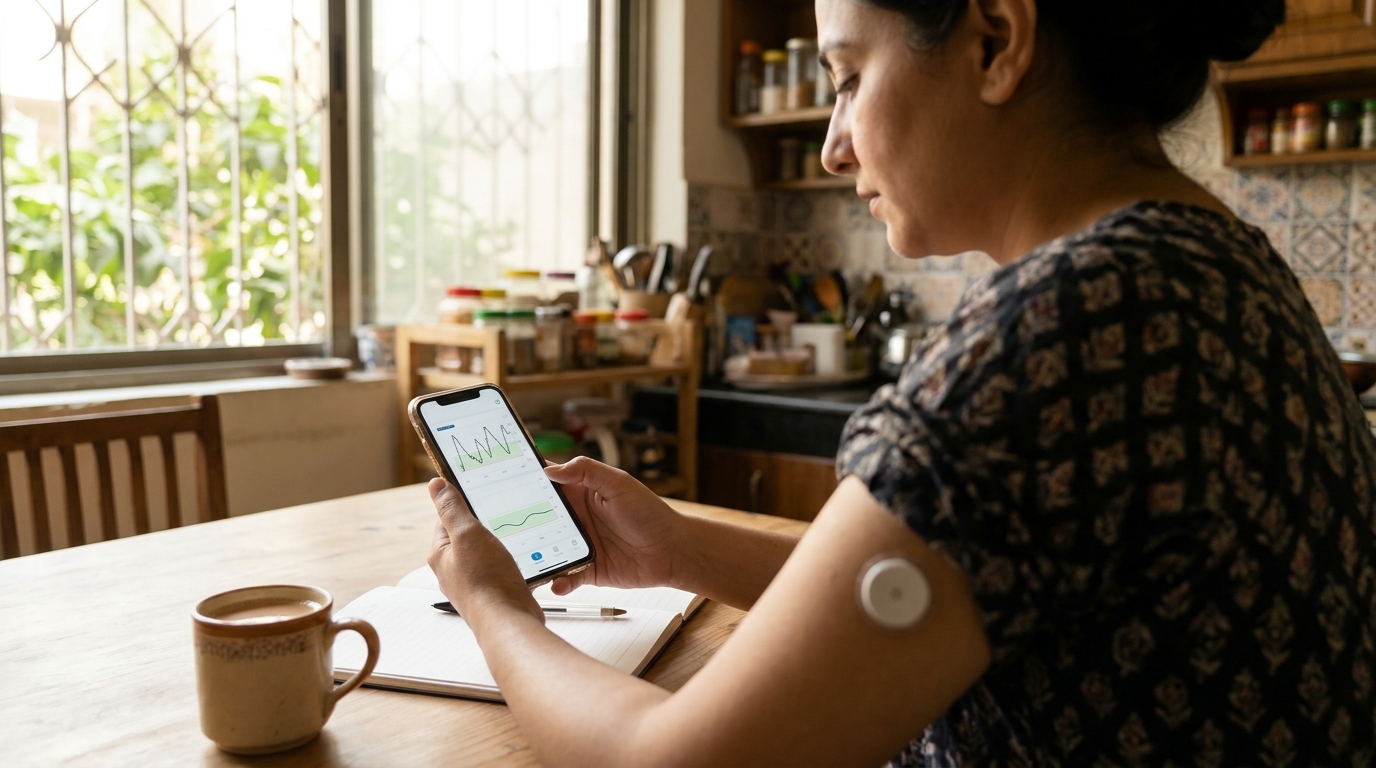
Most continuous monitoring apps show a daily graph, a summary of time in range and, in many cases, an overlay of several days called the ambulatory glucose profile. Reading these reports is a key step in having blood sugar variability explained in your own life.
Look at Time in Range First
Check the share of time spent below, within and above the target range. If you spend too much time above 180 mg/dL, focus on meals and medicine. If you spend time below 70 mg/dL, talk to your doctor about reducing the risk of lows before trying to flatten highs.
Look at the Shape of the Day
Notice when your curve rises, how high it goes and how long it takes to return. Identify the meals or events that produce the biggest peaks, and note any repeating dips, especially at night or before meals.
Compare Days
Compare a good day with a difficult one. What did you eat? How much did you move? How did you sleep? Over a few weeks you will build a personal map of what works.
Check the CV
If your report shows a CV, use it as a quick measure of stability. A value under about 36 percent is generally considered stable, while a higher value suggests there is room to smooth the curve or reduce lows.
How to Reduce Glucose Variability
Lowering variability is usually a matter of many small habits, and the changes should always be made with your healthcare team, especially if you use insulin.
Eat in a Steadier Pattern
Aim for regular meal times and balanced plates that combine vegetables, protein and moderate carbohydrates. Choose whole grains, legumes and fiber-rich foods instead of refined flour and sugar. Keep portion sizes of rice and roti modest, and eat vegetables and protein first when possible.
Walk After Meals
Ten to fifteen minutes of light activity after a meal reduces the peak. Regular exercise improves insulin sensitivity and reduces swings over time.
Match Medicine to Lifestyle
If you see repeated lows or highs at the same time each day, show your reports to your doctor. Adjusting the timing, type or dose of medicine often reduces variability significantly. Do not change doses by yourself.
Protect Sleep and Manage Stress
A consistent sleep schedule, a calm evening routine, limited caffeine and daily relaxation, such as a short walk or quiet prayer and reflection, help to keep stress hormones in check.
Stay Hydrated
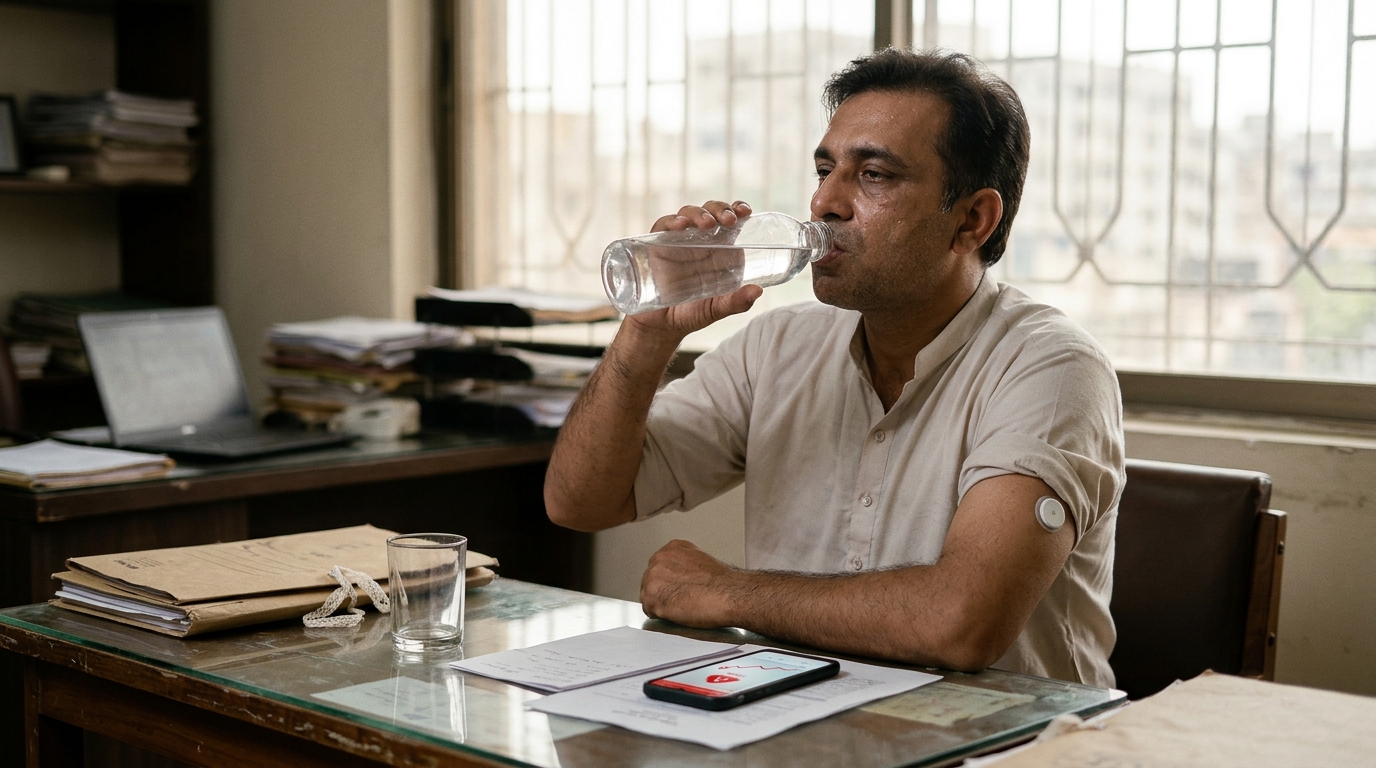
Drink enough water through the day, and avoid replacing water with sugary drinks. Dehydration makes glucose more concentrated and harder to control.
Treat Lows Properly and Avoid Over-Treating
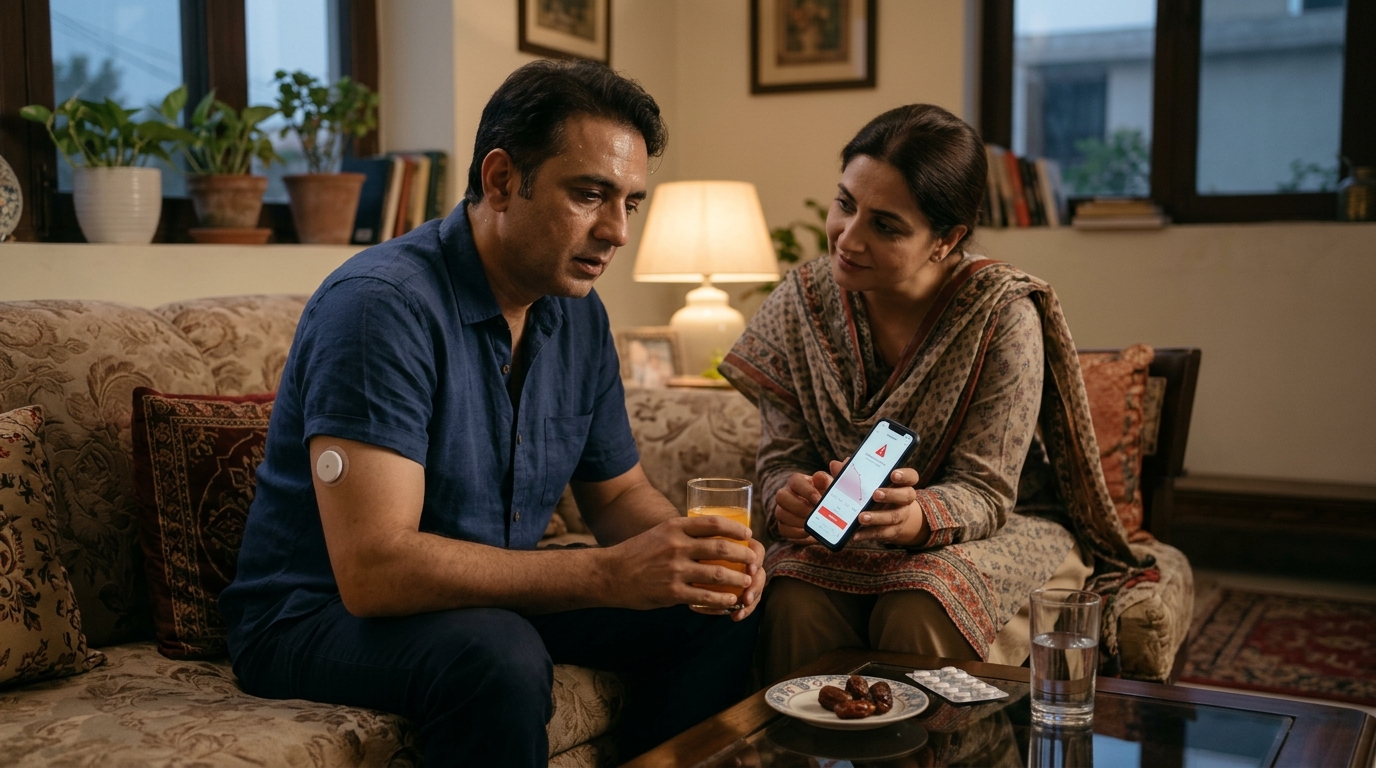
When glucose falls below 70 mg/dL, treat with a measured amount of fast-acting carbohydrate and recheck after fifteen minutes. Over-treating with large amounts of sweets often causes a rebound spike, which adds to the swings.
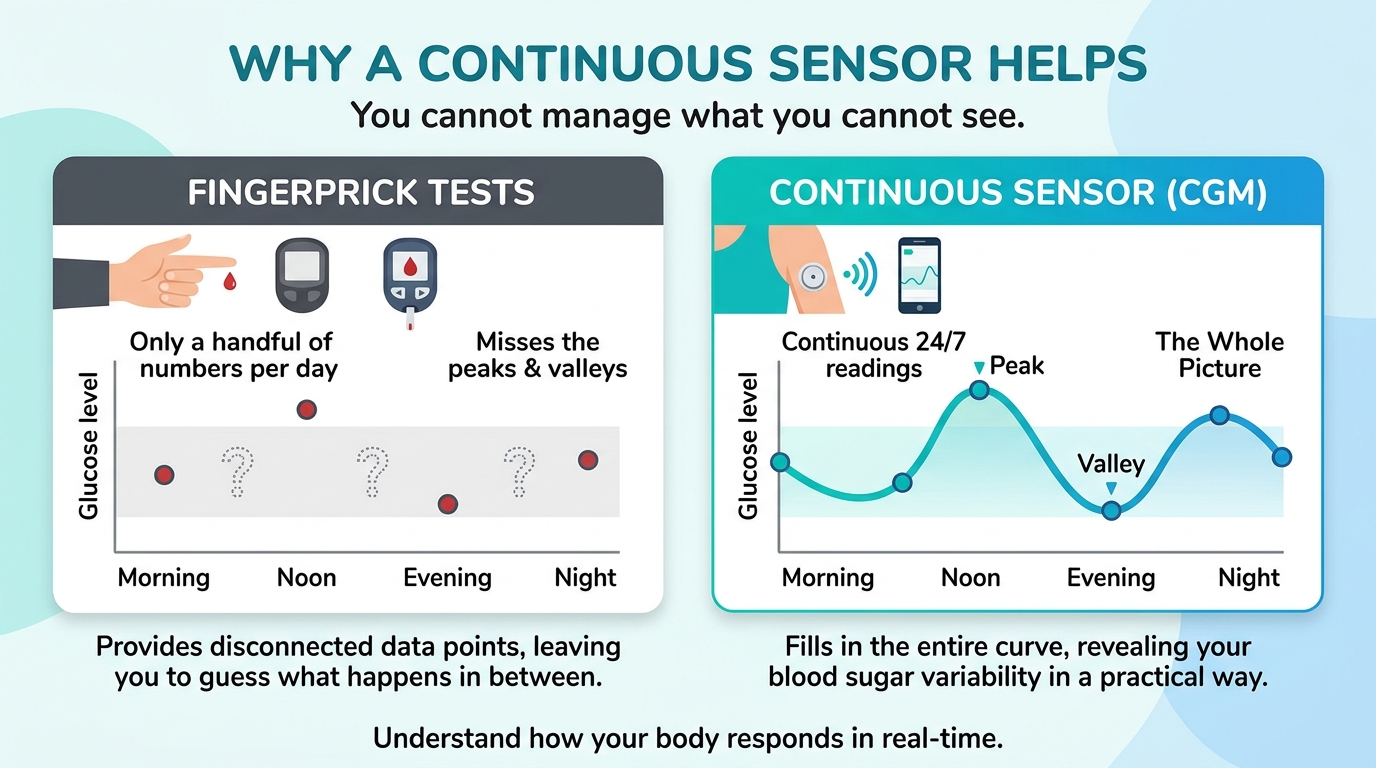
Why a Continuous Sensor Helps
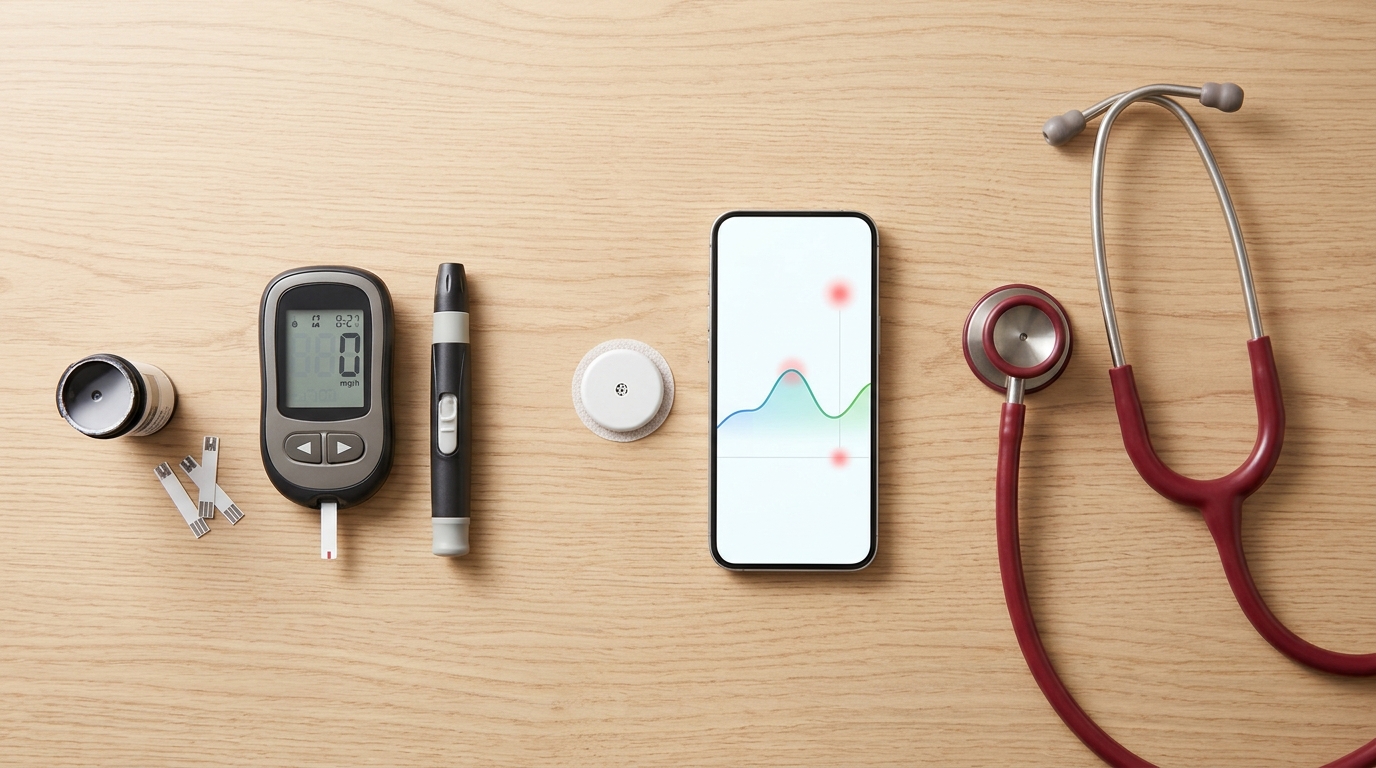
You cannot manage what you cannot see. Fingerpricks provide a handful of numbers per day, which cannot capture a curve with peaks and valleys. A continuous sensor fills in the whole picture, and that is why it is so helpful for anyone who wants blood sugar variability explained in a practical way.
Seeing Patterns, Not Points
With a reading every few minutes, you can see precisely when glucose starts to rise after a meal, how long it stays high and when it falls. You can also see unexpected lows and nighttime dips that fingerpricks would miss completely.
Alerts Reduce Extremes
Real-time alerts for high and low glucose help you intervene earlier. Acting at 80 mg/dL and falling is far safer than reacting at 45 mg/dL, and correcting a rising trend early prevents extreme peaks, which in turn reduces overall variability.
The iCan CGM Features
According to the information on the iCan CGM Pakistan store, the iCan CGM is a 15-day continuous glucose monitor with no scanning and no fingerpricks, a reading every three minutes, up to 7,160 readings per sensor, real-time alerts, an adult MARD of 8.71 percent and IP28 water resistance. The iCan CGM app lets you view trends and reports and share data with your doctor, and the iCan Reach app lets a caregiver follow your readings and receive alerts when you choose to share them. A 15-day wear period is long enough to compare different meals, different days of the week and different routines, which makes it practical for understanding your own variability.
If you are new to sensors, the how to use guide explains the application process, the bundle options help you plan monitoring across several cycles, and the store FAQ page answers common questions. You can also explore more educational content on the iCan CGM blog.
Variability in Different Groups
Different people experience variability differently.
Type 1 Diabetes
People with type 1 diabetes tend to have the highest variability because they depend entirely on external insulin and must balance dose, food and activity constantly. Continuous monitoring is particularly valuable here, and many families use alerts and sharing to keep children safe.
Type 2 Diabetes
In type 2 diabetes, variability is often smaller in people who rely on lifestyle changes or metformin, and larger in those who use insulin or sulfonylureas. Reducing swings may allow doctors to simplify treatment over time.
Prediabetes and Normal Glucose
People with prediabetes may notice large post-meal spikes even when fasting glucose looks normal. Seeing these spikes can motivate early lifestyle changes, which are far more effective before diabetes develops.
Pregnancy
Pregnancy changes insulin needs week by week. Stable glucose is especially important for the health of both mother and baby, and continuous data can help the diabetes team adjust treatment quickly.
Older Adults
In older adults, avoiding lows is often more important than achieving very tight numbers, and targets may be relaxed. Lower variability reduces the risk of falls, confusion and emergency visits.
Myths About Glucose Variability
One common myth is that only people with type 1 diabetes need to worry about variability. In fact, anyone with diabetes or prediabetes can have large swings. Another myth is that a good HbA1c means everything is fine. As we have seen, a good average can hide serious lows and highs. A third myth is that a perfectly flat line is the goal. Healthy bodies move up and down a little, and trying to eliminate every bump is unrealistic and stressful. The aim is stability within a safe range, with a focus on minimizing extreme highs and lows.
When to Speak to a Doctor
Talk to your doctor if your time in range is low, if you have frequent lows, if your CV is persistently high, if your HbA1c does not match your sensor data, or if you have unexplained swings. Bring your sensor reports to your appointment, because they allow your doctor to adjust treatment more precisely. Seek urgent help for severe lows, confusion or symptoms of ketoacidosis. This article is educational and does not replace personal medical advice.
Questions People Ask About Glucose Swings
What is a good CV for blood sugar?
International consensus suggests that a coefficient of variation of 36 percent or less indicates relatively stable glucose, and higher values are associated with greater instability and a higher risk of lows. Your doctor may set a personalized goal, especially if you use insulin.
Can variability be high even if my HbA1c is normal?
Yes. Because HbA1c is an average, a person can have many highs and lows that cancel each other out and still have an acceptable result. Continuous monitoring reveals the swings that HbA1c cannot show.
Does high glucose variability cause complications?
Sustained high glucose is clearly linked to complications. Variability may add risk through oxidative stress, but research is still developing and results are mixed. Aiming for stable glucose within the target range and avoiding severe lows is a sensible approach.
How long should I wear a sensor to understand my pattern?
Most experts suggest at least ten to fourteen days of data to get a reliable picture of your patterns. The iCan CGM has a 15-day wear time, which covers that period in a single sensor.
What is the quickest way to reduce swings?
There is no single fix, but balanced meals, regular timing, post-meal walks, adequate sleep, enough water and medicine adjustments guided by your doctor usually make the biggest difference. A sensor lets you see which of these changes helps you most.
Final Thoughts
Having blood sugar variability explained helps you see beyond a single number and understand the story told by your whole glucose curve. Stable glucose means fewer lows, fewer extreme highs, more energy and a clearer picture for your doctor. With balanced food, regular movement, good sleep, adequate hydration and proper medicine timing, most people can steady their swings over time. A continuous sensor turns that journey from guesswork into evidence. If you are ready to see your own variability and take control of it, explore the iCan CGM at icancgm.pk and start learning from your own data.