For decades, HbA1c was the number that mattered most in diabetes management. Doctors relied on it, patients tracked it, and treatment plans were often built around getting that single figure down. But HbA1c only tells part of the story. It gives you an average, and averages can hide a lot of movement underneath. Two people can have the exact same HbA1c while one spends their days on a smooth, steady glucose curve and the other swings between dangerous lows and uncomfortable highs.
This is where Time in Range, usually shortened to TIR, has changed the conversation. With the rise of continuous glucose monitors, doctors and patients now have access to detailed, minute by minute data that HbA1c alone could never provide. TIR has become one of the most talked about metrics in modern diabetes care, and for good reason.
What Exactly Is Time in Range
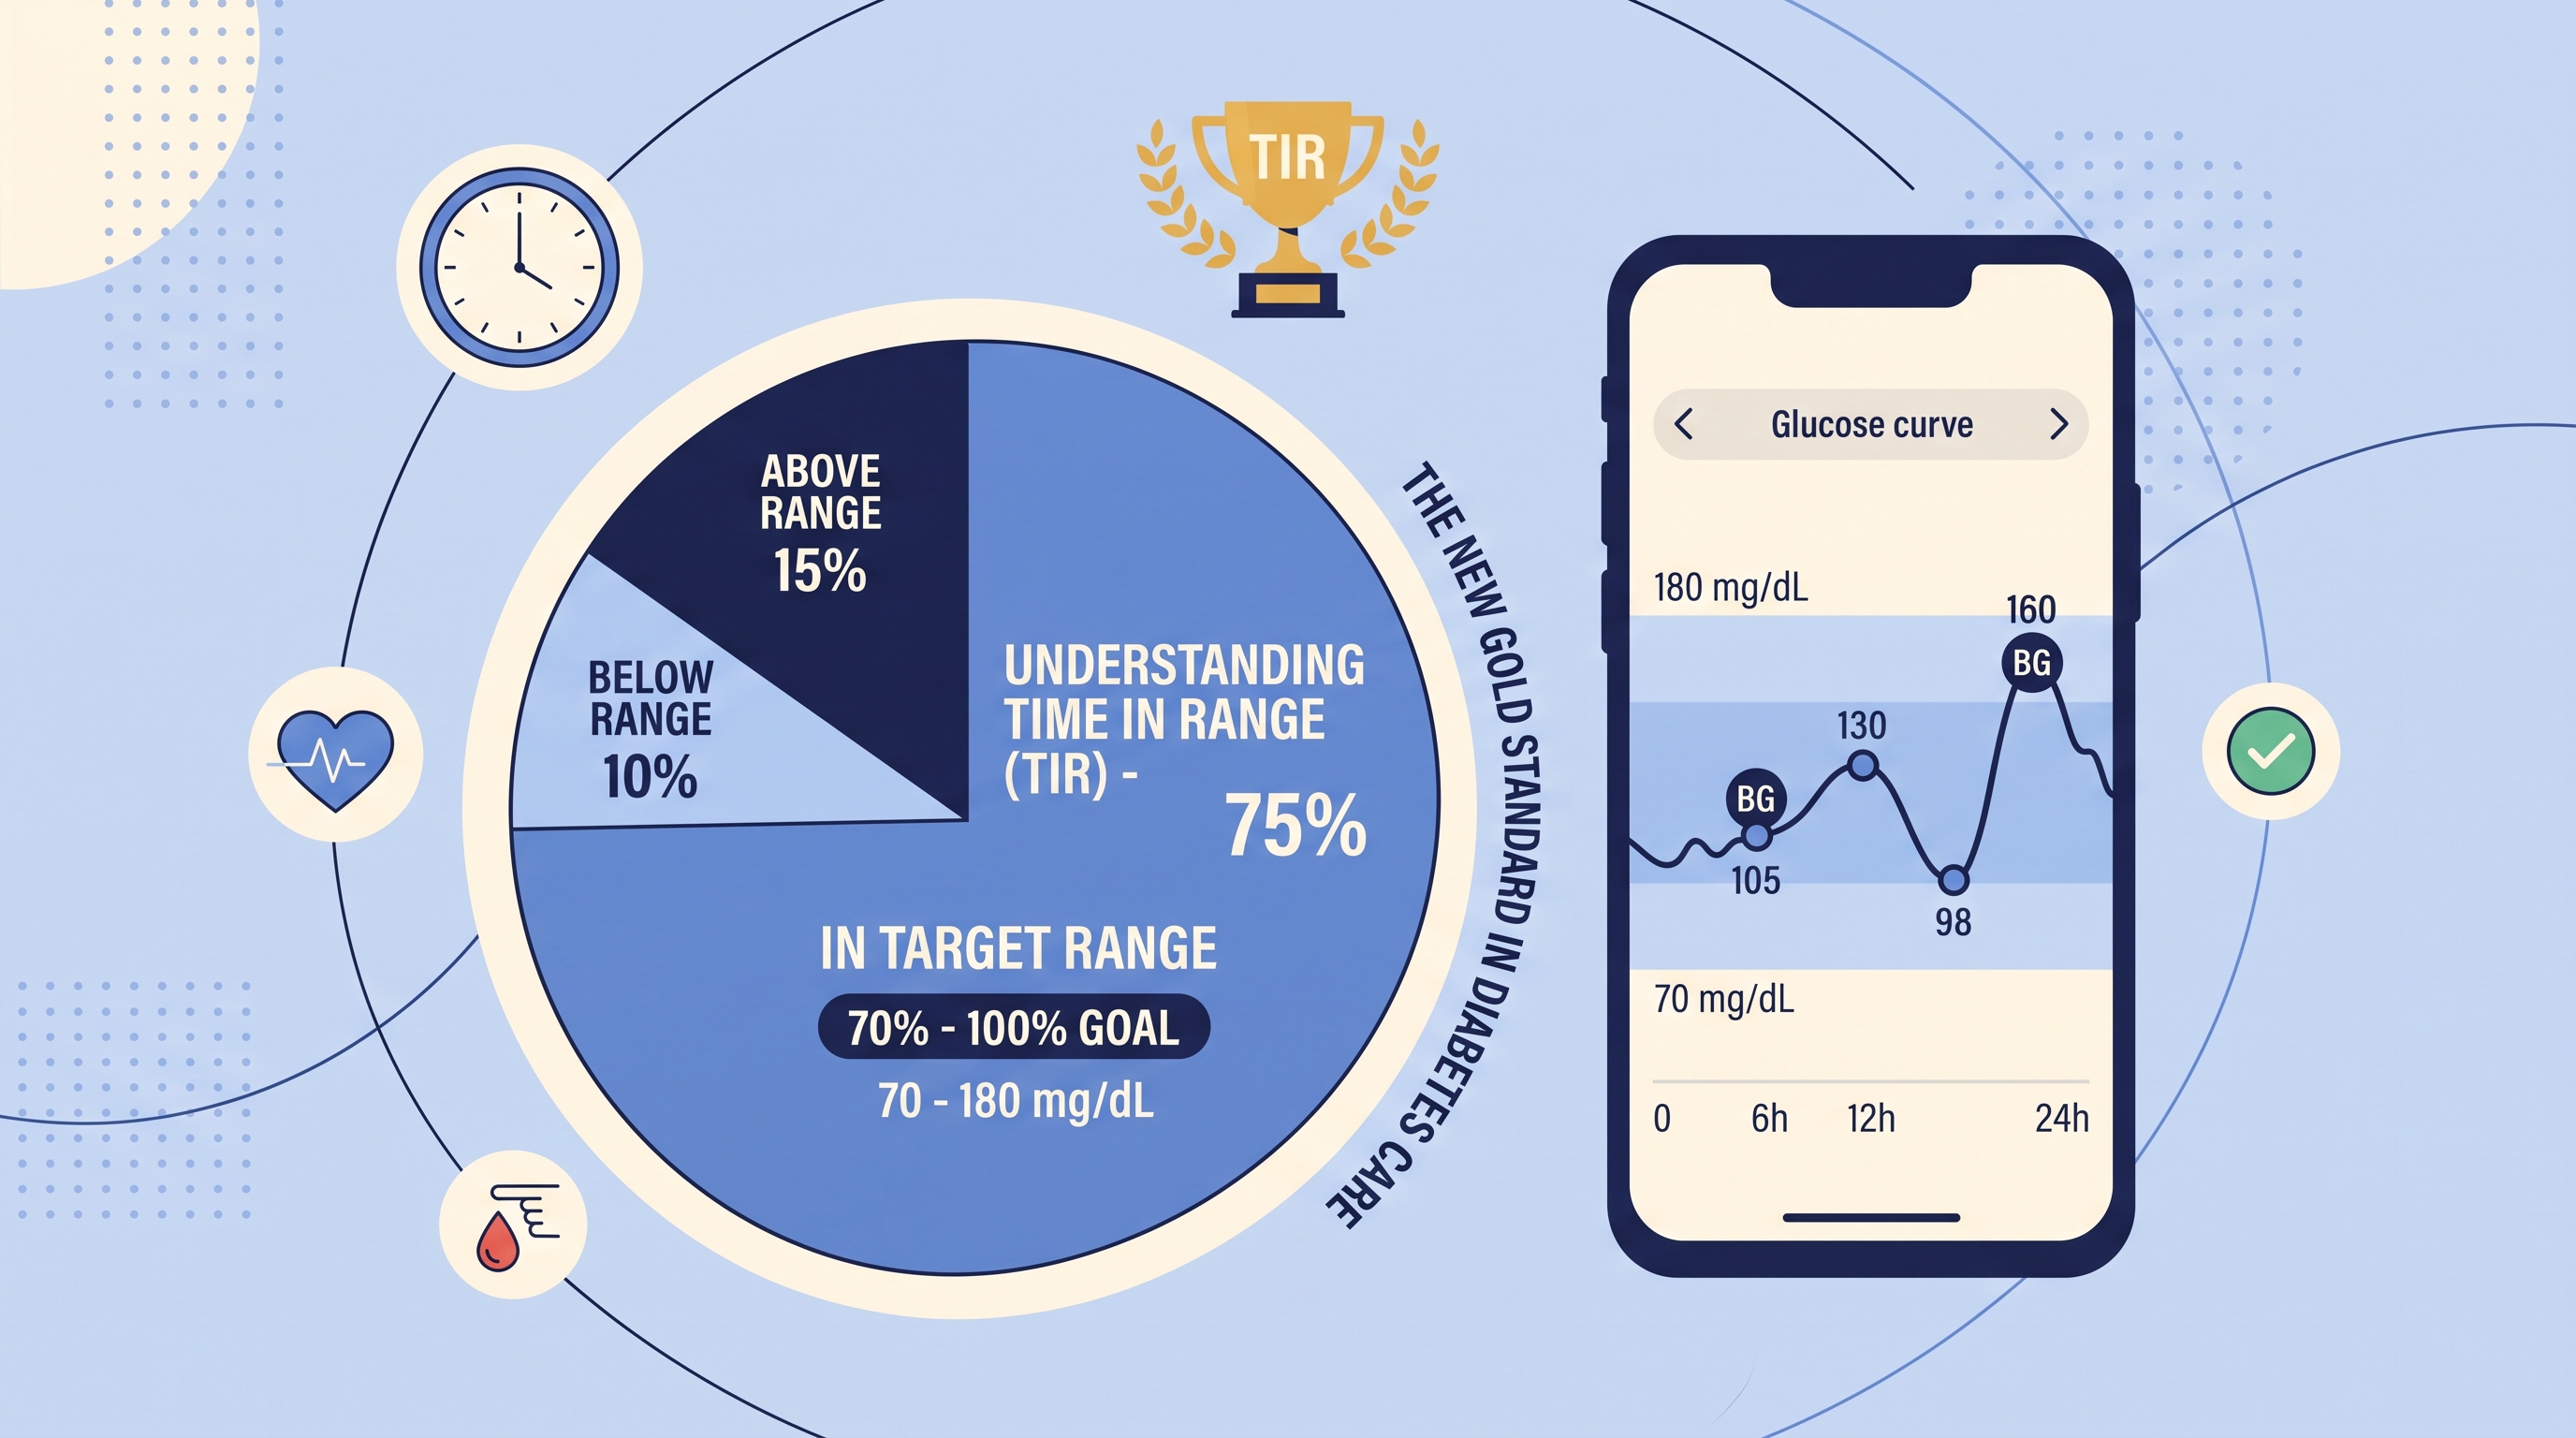
Time in Range refers to the percentage of time your glucose levels stay within a target range, typically between 70 and 180 mg/dL for most adults with diabetes, though this range can be adjusted by your doctor based on your individual needs, age, and other health conditions.
Instead of giving you a single average number like HbA1c, TIR shows you the full pattern of your day. It tells you how often you were in a healthy range, how often you dipped too low, and how often you climbed too high. A continuous glucose monitor like iCan CGM captures a new reading every few minutes, which means your TIR is built from hundreds of data points a day rather than a single blood draw every few months.
The Three Zones of Time in Range
TIR reports typically break your day into three zones, and understanding each one helps you see the full picture of your glucose control.
Time Below Range
This is the percentage of time your glucose drops below the target threshold, usually below 70 mg/dL. Even short periods of low glucose can be dangerous, especially if they happen without warning symptoms, a condition known as hypoglycemia unawareness. Reducing time below range is often the first priority for doctors, since severe lows carry more immediate risk than moderate highs.
Time in Range
This is the core number most people focus on: the percentage of the day your glucose stays within the healthy target zone. Diabetes organizations generally recommend aiming for at least 70 percent of the day in range, though this target is adjusted for pregnant women, older adults, and people with other health considerations.
Time Above Range
This tracks how much of your day is spent above the target ceiling, usually above 180 mg/dL. Frequent or prolonged time above range is linked to long term complications, even if your average HbA1c looks reasonable on paper.
Why TIR Gives You More Than HbA1c Ever Could
HbA1c reflects your average blood glucose over roughly the past two to three months. The problem is that an average can be mathematically correct while still hiding a rollercoaster of highs and lows underneath it. Someone who spikes to 250 mg/dL after every meal and then crashes to 60 mg/dL a few hours later could end up with a similar HbA1c to someone whose glucose stays gently between 100 and 140 mg/dL all day. On paper, their numbers might look alike. In reality, their health outcomes and daily experience of diabetes are completely different.
TIR fills this gap by showing the shape of your glucose curve, not just its average. This is particularly valuable for spotting patterns tied to specific meals, activities, sleep, or stress that would otherwise go unnoticed. When you pair TIR data with a device like iCan CGM, you start to see cause and effect in near real time instead of guessing after the fact.
A Simple Way to Think About It
Imagine driving a car and only being told your average speed for the entire trip. That average might be a safe 60 kilometers per hour, but it would not tell you whether you spent long stretches speeding dangerously or crawling to a stop in traffic. TIR is like having a full speed log for the whole journey, showing you exactly where the risky moments happened.
How CGM Technology Makes TIR Possible
Before continuous glucose monitors became widely available, calculating anything close to TIR required frequent finger pricks throughout the day and night, which was neither practical nor sustainable for most people. A device like iCan CGM changes this by automatically recording glucose readings around the clock, building a complete picture without any extra effort from the user beyond wearing the sensor.
Automatic Data Collection
Once the sensor is applied, it continues logging glucose readings throughout the day and night, including during sleep, a period that is almost impossible to monitor accurately with traditional finger pricking. This constant stream of data is what makes an accurate TIR calculation possible in the first place.
Visual Reports You Can Actually Understand
The iCan CGM app translates this raw data into visual reports, often using color coded graphs where green represents time in range, red represents lows, and yellow or orange represents highs. This visual format makes it much easier to spot patterns at a glance compared to scrolling through pages of individual numbers.
How to Improve Your Time in Range
Improving TIR is not about chasing a perfect score every single day. It is a gradual process of noticing patterns and making small, sustainable adjustments over time.
Look at Meal Timing and Composition
Many people discover through CGM data that specific meals, rather than food in general, are responsible for the majority of their time above range. A large plate of rice at lunch might send glucose climbing far higher than a smaller portion paired with protein and vegetables. Reviewing your TIR reports alongside a food log can reveal these connections clearly.
Pay Attention to Overnight Patterns
Overnight lows or highs often go unnoticed without continuous monitoring, since most people are asleep and unaware of what is happening. If your TIR reports consistently show dips in the early morning hours, this is worth discussing with your doctor, as it may point toward adjustments in evening medication timing or dosage.
Use Alerts to Catch Trends Early
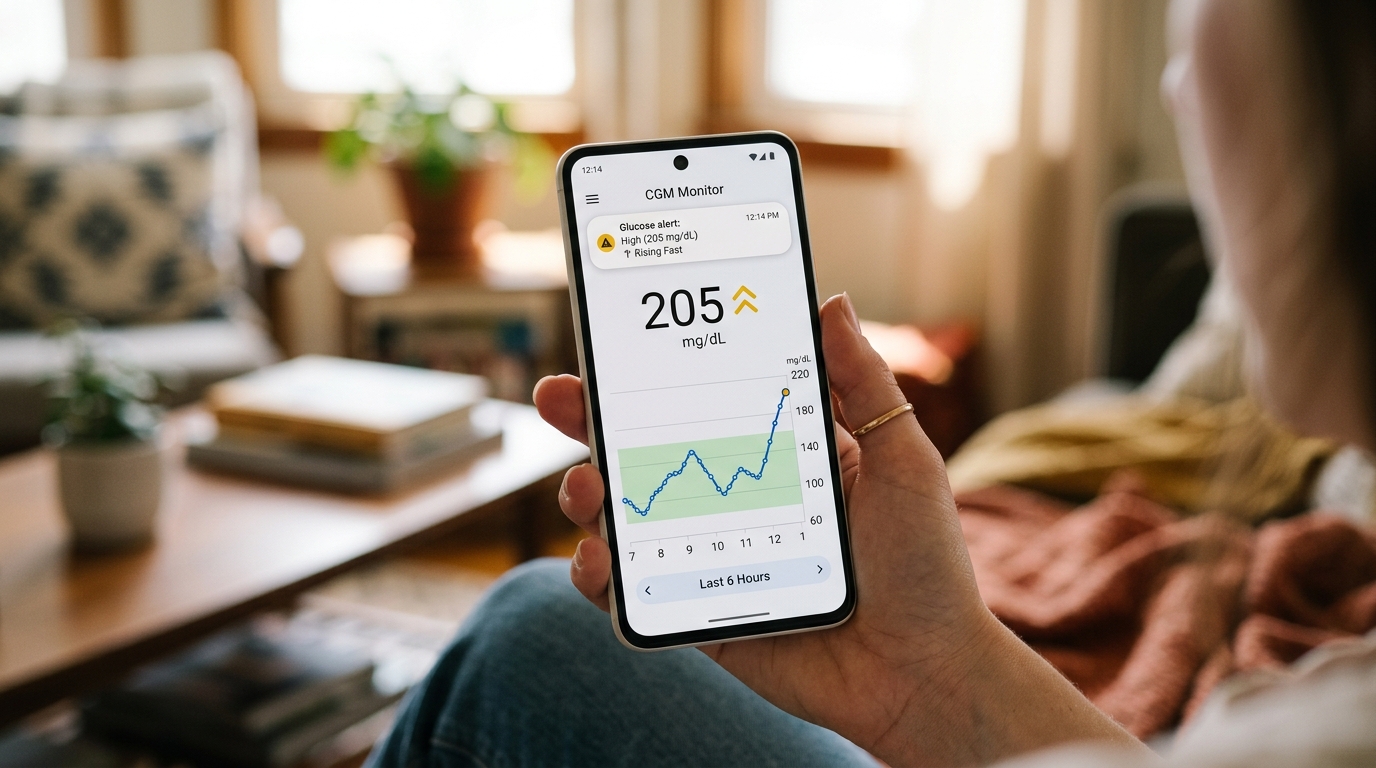
Setting custom high and low alerts on your CGM app allows you to respond to trends before they become significant swings. Instead of discovering a low after it has already happened, an alert gives you the chance to act while glucose is still trending in that direction.
Track Activity Alongside Glucose
Physical activity has a measurable effect on glucose levels, and this effect can last for hours after exercise ends. Reviewing your TIR data on active days versus sedentary days often reveals just how much movement contributes to keeping glucose steady.
Setting Realistic TIR Goals
Not every person with diabetes should aim for the exact same target. General guidelines suggest a TIR goal of 70 percent or higher for most adults with type 1 or type 2 diabetes, with adjusted, more lenient targets for older adults, pregnant women, and people with a history of severe hypoglycemia. Your doctor is best placed to help you set a target that reflects your individual health situation rather than a generic number pulled from a guideline.
Progress Over Perfection
It is worth remembering that TIR is a tool for identifying patterns and making gradual improvements, not a test to pass or fail. A week with 65 percent time in range followed by a week at 72 percent still represents real progress. Treating small improvements as meaningful wins tends to build more sustainable habits than chasing a perfect score from day one.
Bringing It All Together
Time in Range has reshaped how doctors and patients think about diabetes control, moving the focus away from a single averaged number and toward the actual daily experience of living with the condition. With a continuous glucose monitor like iCan CGM providing the detailed data needed to calculate TIR accurately, patients now have a much clearer window into how their choices, from meals to sleep to activity, actually affect their glucose in real time.
If you have been relying on HbA1c alone to judge your diabetes control, TIR is worth bringing into the conversation with your doctor. It will not replace HbA1c entirely, but together the two give a far more complete picture of what is really happening inside your body day to day.