
If you have diabetes, you already know the HbA1c test well. It's the blood test your doctor orders every few months to check how your management is going, and it's one of the most important tools in diabetes care. But on its own, it's also an incomplete one.
HbA1c tells you an average. It doesn't tell you the story behind that average, and that story matters quite a bit. This article explains what HbA1c actually measures, where it falls short, and why pairing it with real time data from a continuous glucose monitor gives both you and your doctor a much fuller picture of your health.
What HbA1c Actually Measures
HbA1c, or glycated hemoglobin, is a blood test that measures the percentage of hemoglobin, the protein in your red blood cells that carries oxygen, that has glucose attached to it. Since red blood cells live for about three months, this test reflects your average blood glucose over roughly the last two to three months.
This is genuinely useful information. It's why HbA1c has become the standard test doctors rely on to diagnose diabetes and track long term control, and why targets like keeping your A1c below 7 percent come up so often in diabetes management.
The Problem With Averages
Here's the catch. Imagine two people who both have an HbA1c of 7 percent.
Person A has fairly steady glucose all day, usually sitting somewhere between 130 and 160, with only mild variation.
Person B swings a lot, dropping to 55 in the early morning, a dangerous low, then spiking to 250 after lunch, a dangerous high, before dropping again in the evening.
Mathematically, both people could land on that same 7 percent result. But clinically, they're in very different situations. Person B is dealing with dangerous highs and lows that could cause real harm, from confusion or fainting during a severe low to long term vascular damage from repeated highs, and none of it shows up in the average.
That's the core limitation of HbA1c. It can't tell the difference between stable, well controlled glucose and wild swings that happen to average out to the same number. Two very different health pictures can produce the exact same result.
What HbA1c Simply Cannot Show You
An HbA1c result cannot reveal the daily and hourly ups and downs of your glucose. It won't catch nighttime lows, the kind of hypoglycemic episodes that happen while you're asleep and often go completely unnoticed. It can't show post meal spikes, or how dramatically a specific food affects you and how long it takes your sugar to settle back down.
It also won't show your time in range, meaning the percentage of the day your glucose actually stays within a healthy target. It won't tell you when highs and lows tend to happen, whether that's morning, after certain meals, during exercise, or overnight. And it won't show the rate of change, meaning whether your glucose is rising or falling quickly right now, which matters a lot when you need to make an immediate decision.
These aren't small details. Many diabetes specialists now consider time in range, a metric only a CGM can give you, to be just as important clinically as HbA1c itself.
How Real Time CGM Data Fills This Gap
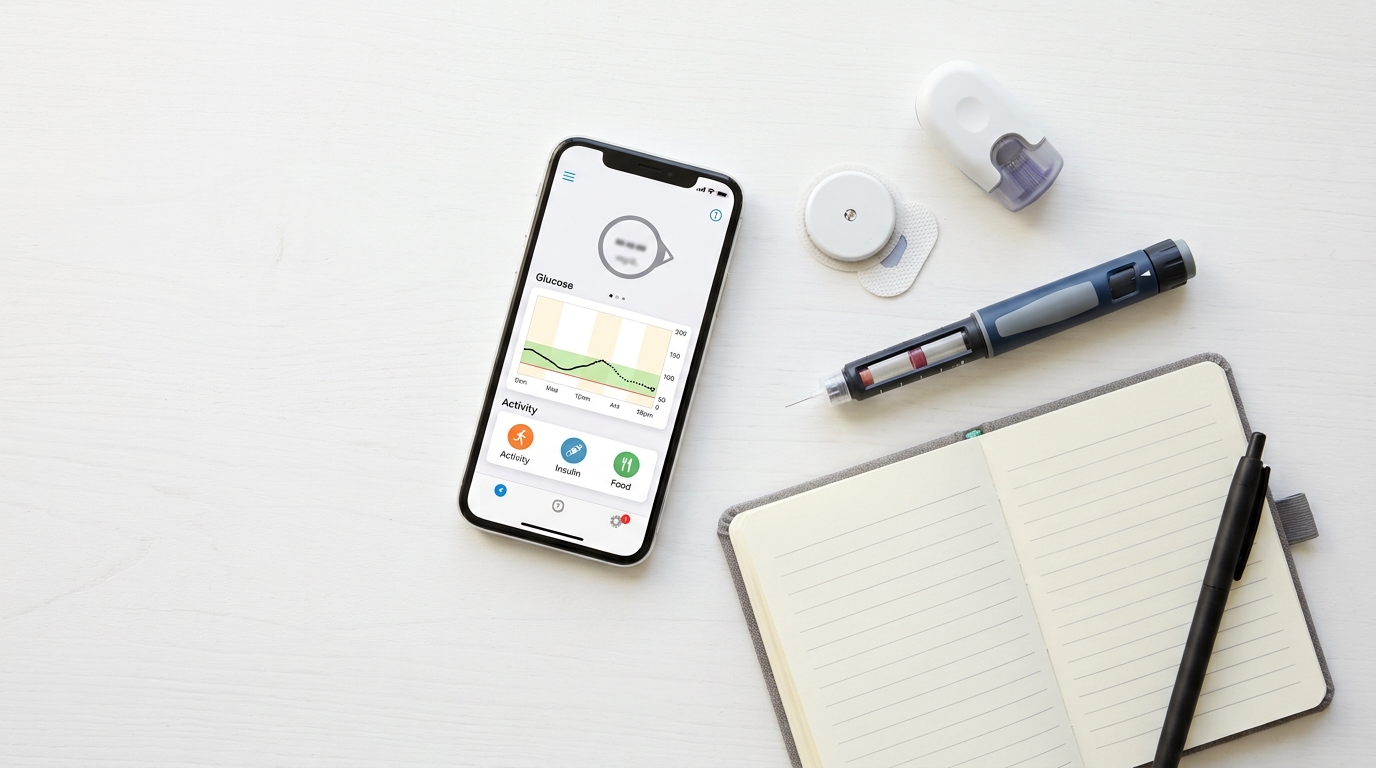
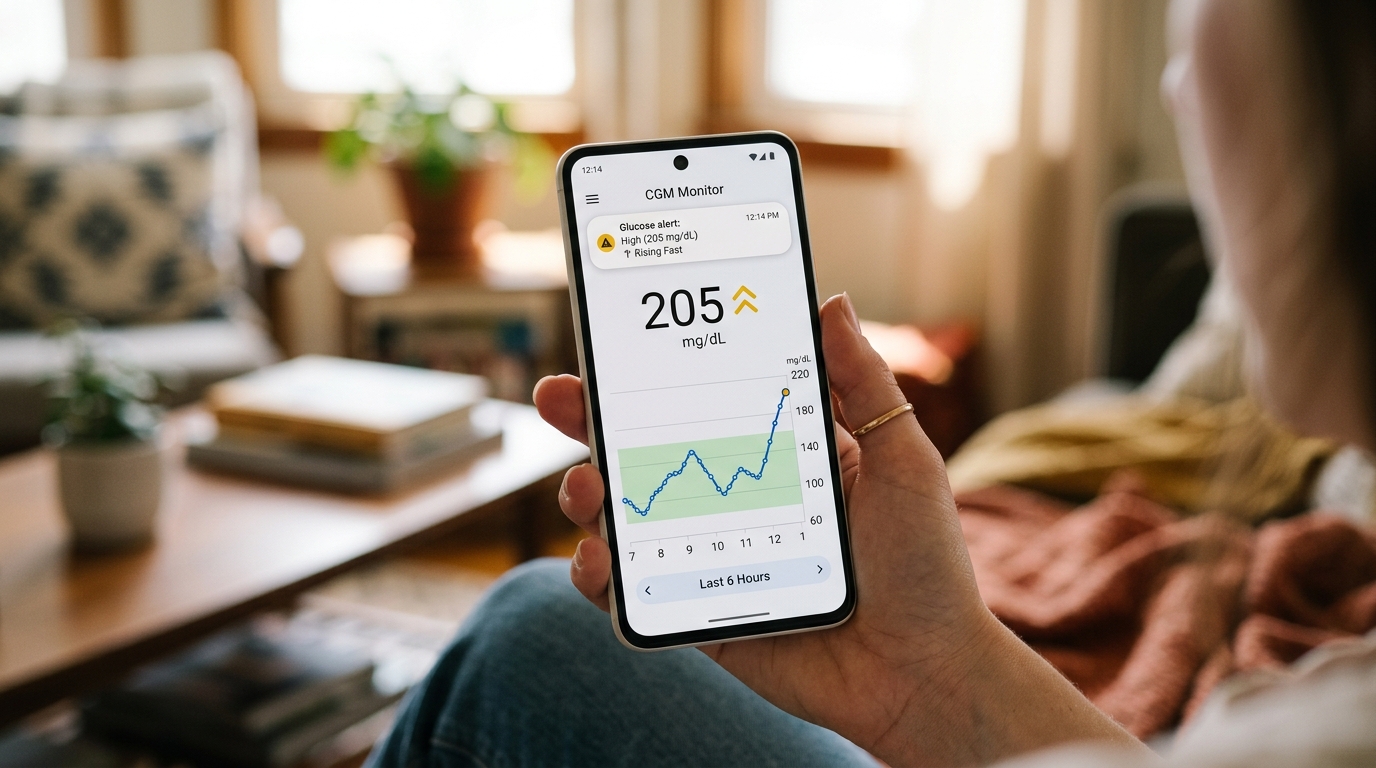
A continuous glucose monitor like the iCan i3 measures your glucose automatically every few minutes, day and night, and sends that data straight to your phone. Instead of one average number every few months, you get a detailed, ongoing graph of exactly how your glucose behaves in real time.
This means you might discover that your glucose quietly drops to 60 most nights around 3am, without you ever waking up or feeling a thing. Or that a breakfast you've eaten for years actually spikes your sugar to 220 every single morning. Or simply that your glucose is climbing right now, giving you the chance to act before it turns into a real problem, rather than finding out three months later in a lab report.
This kind of visibility changes diabetes management from something reactive, where you find out after the fact, into something proactive, where you can see a problem developing and respond to it immediately.
Why Doctors Increasingly Want Both
It's worth saying clearly that HbA1c isn't outdated, and CGM data doesn't replace it. The two work best side by side.
HbA1c still gives a valuable long term benchmark, useful for diagnosis, medical records, and tracking progress over months and years. It's a well established, standardized measure that every doctor already understands.
But CGM data fills in the missing context. When you bring both your HbA1c result and a few weeks of CGM data to an appointment, your doctor can see not just what your average glucose was, but why it landed there, whether it came from fairly steady control or from dangerous daily swings that need to be addressed right away.
Many endocrinologists now specifically ask for an Ambulatory Glucose Profile, a report generated from CGM data, alongside the HbA1c test, precisely because it shows patterns the lab test alone simply cannot.
A Simple Way to Picture This
If HbA1c is like checking the average balance in your bank account over the last three months, a CGM is like seeing every single transaction, when money came in, when it went out, and what caused each change. The average balance tells you something, but if you actually want to fix a spending problem, you need the full transaction history too.
Glucose works the same way. The average, your HbA1c, tells you roughly where you stand. The transaction history, your CGM data, tells you how you actually got there and what to change going forward.
Key CGM Metrics Worth Knowing
Once you start using a CGM alongside regular HbA1c testing, a few new terms will come up that are becoming standard in modern diabetes care.
Time in range is the percentage of the day your glucose stays within your target zone, usually 70 to 180, though your doctor may set different targets for you. A high time in range is closely linked to fewer long term complications, regardless of what your HbA1c shows.
Time above range and time below range break down exactly how much of your day is spent too high or too low, which is essential for adjusting medication timing and dosage, and for spotting dangerous patterns like recurring nighttime lows.
Glucose variability measures how much your sugar swings up and down across the day. Two people can share the same average glucose while having very different variability, and high variability is now recognized as its own risk factor, separate from the average number.
The Ambulatory Glucose Profile is a standardized report built from CGM data that overlays several days of readings into a single visual pattern, designed to be reviewed together with HbA1c during doctor visits for a quick, clear summary of your typical day.
Bringing these numbers to your next appointment alongside your HbA1c gives your doctor a genuinely complete view of your management, not just where your average landed, but exactly how you got there.
How Often Should You Check Each One
Most guidelines suggest an HbA1c test every three to six months, depending on how stable your management is and how recently your treatment changed. A CGM works differently. It isn't meant for an occasional snapshot. It's most useful worn continuously, or at least for a solid two to four weeks at a time, since patterns like weekend versus weekday differences, or the effect of a new medication, often only become clear after a few weeks of data.
Some people wear a CGM continuously for ongoing management, especially those on insulin or with a history of severe highs or lows. Others use it periodically, for example for a few weeks after a diagnosis, after starting a new medication, or before a major appointment, specifically to collect detailed data to review with their doctor. Both approaches work, and the right one depends on your risk level, your budget, and how much day to day insight you personally want.
What This Means for You
If you've only ever tracked your diabetes through periodic HbA1c tests and occasional finger pricks, there may be patterns affecting your health right now that a few months of CGM data could reveal almost immediately.
Wearing a CGM like the iCan i3 for even a few weeks can uncover things like unnoticed overnight lows, specific foods that spike your glucose more than you expected, or a slow upward drift in your baseline that hasn't shown up dramatically in your A1c yet. With that information, you and your doctor can make much more targeted changes to your diet, medication, or insulin dosing, instead of guessing based on a single average number.
Final Thoughts
HbA1c will likely always have a place in diabetes care as a long term benchmark. But on its own, it's an average with all the detail smoothed away, and in diabetes management, the detail is often exactly where the real risks and the real opportunities for change are hiding.
Pairing your HbA1c results with real time, continuous glucose data gives you the full picture, not just where you ended up, but how you got there, and what you can do differently starting today.